Exploratory testing
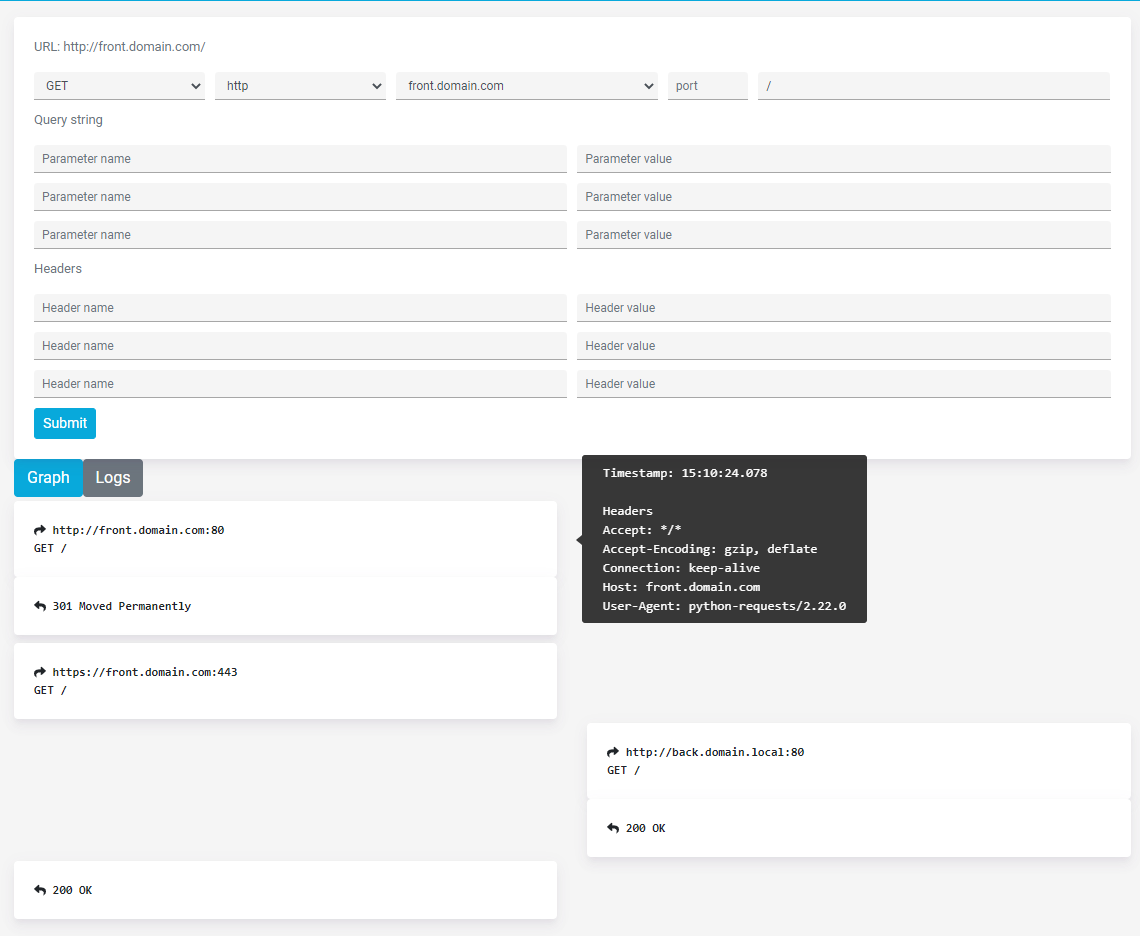
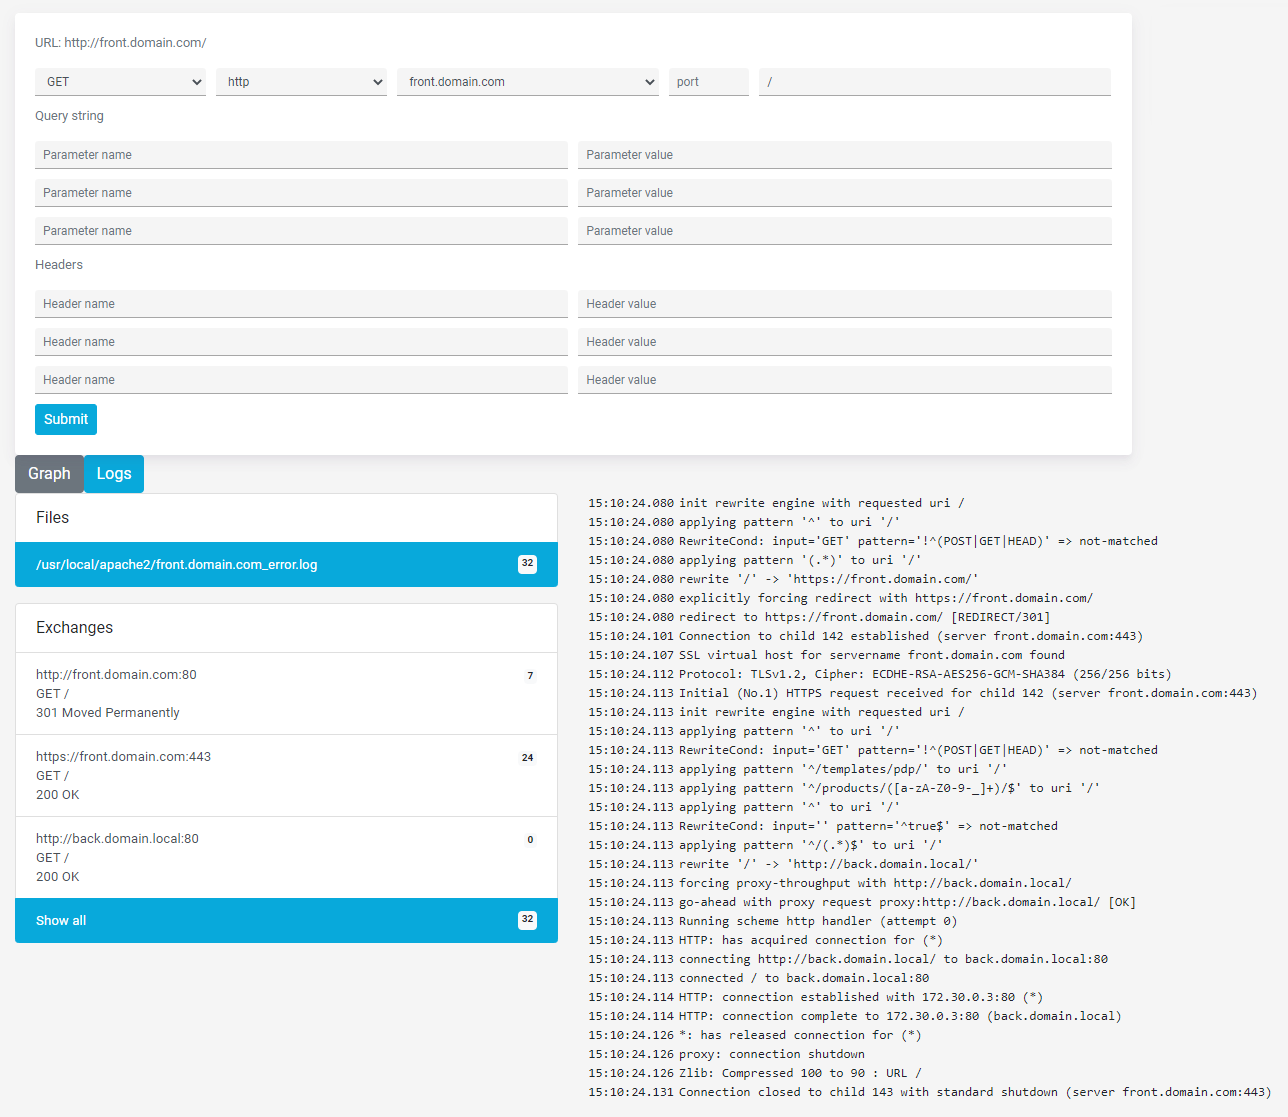
Habit server exposes web interface on port 7080 where you can manually craft requests with a Postman-like interface and check the visual representation of request processing graph.
To be able to use this feature you have to:
-
set up the Habit server
-
set up the project - JUnit tests are optional
-
create the testing environment through Habit Gradle plugin task
:environmentStart -
visit the
http://server-host:7080URL in a browser -
go to your environment to the request crafting section
-
define a request, send it and check the graph
-
make changes to Apache configuration
-
deploy changes by executing
./gradlew :environmentStart -
send the same request again to check the updated processing graph
Dev mode
Manually starting configuration deployment after introducing every change might be a bit tedious. To make things easier a dev mode is supported by the Gradle plugin.
-
execute
./gradlew :devMode -
introduce changes to Apache configuration
-
save the file
-
configuration will be deployed automatically
-
in case of syntax errors an appropriate message will be shown in the terminal
Dev mode is not that useful when executing JUnit tests as it will make sure the newest configuration is deployed before running any test.

